Picking the “most reliable” AI tool sounds simple until you try to actually measure it. Reliability is not a single number you can read off a marketing page. It is a pattern that emerges over time, across different kinds of disruption, and it looks different depending on whether you are a casual user, a developer building on an API, or a team that depends on one assistant for daily work. This guide explains how to compare AI tools honestly: what uptime really means, why one bad day can distort a whole month, the difference between a full outage and degraded service, and why a transparent public status page is itself one of the strongest reliability signals you can find. You can apply all of it on our live status dashboard, where ChatGPT, Claude, Gemini, Grok, Copilot, DeepSeek, and Character.AI sit side by side.
What “reliability” actually means for an AI tool
When people search for the most reliable AI tool, they usually mean one thing: “Will it work when I need it?” But that question hides several separate dimensions, and a tool can score well on one while failing on another.
- Availability – is the service reachable and accepting requests at all?
- Performance – when it does respond, is it fast, or is it crawling under load?
- Consistency – does it behave the same way today as it did last week, or do features quietly break and return?
- Recovery – when something does go wrong, how quickly does it come back, and how openly is it communicated?
A service that is up 99% of the time but takes hours to recover from each incident can feel less reliable than one with slightly more frequent but very short blips. Reliability is the whole shape of the experience, not just the headline availability figure.
Why a single uptime percentage can mislead you
Uptime is the metric everyone reaches for first, and it is useful, but it is also the easiest to misread. “Uptime” is simply the share of a measurement window during which the service was reachable and responding normally. The trouble is in the window and the math.
The averaging problem
Monthly uptime smooths everything into one number. Imagine a service that ran flawlessly for 29 days and then had one rough day with several hours of disruption. Spread across a 30-day month, that still produces a high-looking percentage, even though anyone relying on the tool during that one day had a genuinely bad experience. One concentrated incident and a scatter of tiny blips can produce the same monthly figure while feeling completely different to use.
Time window matters enormously
A 24-hour view, a 7-day view, and a 90-day view of the same service can tell very different stories. A tool that looks shaky this week might be rock solid over a quarter, having just hit one unlucky patch. The opposite is also true: a service can look pristine this week while hiding a recurring weekly pattern that only a longer window reveals. Always check more than one timeframe before drawing a conclusion. On individual service pages such as ChatGPT and Claude, the history view lets you widen the lens instead of judging on a single snapshot.
What counts as “down”?
Two trackers can report different uptime for the same service simply because they define “down” differently. Does a slow but working response count as an outage? Does a single failed region count, or only a global failure? This is exactly why a published methodology matters. Numbers without a definition behind them are just decoration.
Full outage vs degraded vs partial: learn the difference
Treating every disruption as a binary up-or-down event is the most common mistake in comparing AI tools. Real-world reliability lives in the gradations, and the categories below behave very differently.
- Full outage – the service is completely unreachable. Requests fail, the app will not load, the API returns errors across the board. These are the most obvious and usually the shortest, because they are impossible to ignore and get fixed fast.
- Degraded performance – the service responds, but slowly or unevenly. You get answers, but they take far longer, time out intermittently, or the model feels noticeably weaker. Degradation is more common than full outages and harder to detect, because there is nothing definitively “broken” to point at.
- Partial outage – one part works while another does not. The chat interface might be fine while file uploads, image features, voice mode, or the developer API are failing. Partial outages explain why your colleague insists everything is normal while you cannot get a single thing done. You are using different features.
When you compare tools, ask not just how often they go fully dark, but how often they slip into degraded or partial states. A service that rarely has total outages but frequently runs slow under load may be more disruptive in practice than its uptime number suggests. Our guide on why AI tools go down breaks down the technical causes behind each of these states.
Transparency is itself a reliability signal
Here is a counterintuitive but important point: a service that publicly admits its problems is often more reliable than one that stays silent. A public status page does not cause outages. It reveals them. The presence of honest, detailed, real-time status communication tells you several good things about a provider.
- They have the internal monitoring to detect problems quickly.
- They have a culture of accountability rather than hoping users will not notice.
- They give you a place to confirm whether an issue is on their side, so you are not wasting time debugging your own setup.
When you evaluate a tool, look for whether it maintains an official status page, how promptly that page updates when something breaks, and whether incidents come with post-incident explanations. A provider that posts a clear note within minutes is demonstrating operational maturity. A provider whose status page stays stubbornly green while social media fills with complaints is showing you the opposite. Silence is not the same as stability.
Why crowd-sourced reports complete the picture
Official status pages have one structural weakness: they are written by the company being measured. They can lag, they can understate, and they sometimes only flip to “investigating” once a problem is undeniable. This is where crowd-sourced user reports become essential.
When real users report trouble at the same moment from many places, that signal often moves faster than an official acknowledgment. A spike in user reports is an early-warning system. It can catch the degraded and partial states that official dashboards are slow to admit, and it captures the lived experience: “voice mode keeps dropping,” “responses are timing out,” “the API is throwing errors.” The most trustworthy view of reliability combines both sources. Official status confirms the cause and scope; crowd reports confirm the timing and the human impact. On is-down.ai, the live pages blend automated monitoring with user reports so you are not relying on a single, potentially biased source.
If you are ever unsure whether a problem is the service or your own connection, our guide on telling the difference between a real outage and a local issue walks through how to use these signals together.
How to compare services side by side on is-down.ai
The fastest way to judge reliability is to stop reading marketing claims and look at live behavior. Here is a practical workflow using the live dashboard.
Start with the current state across all services
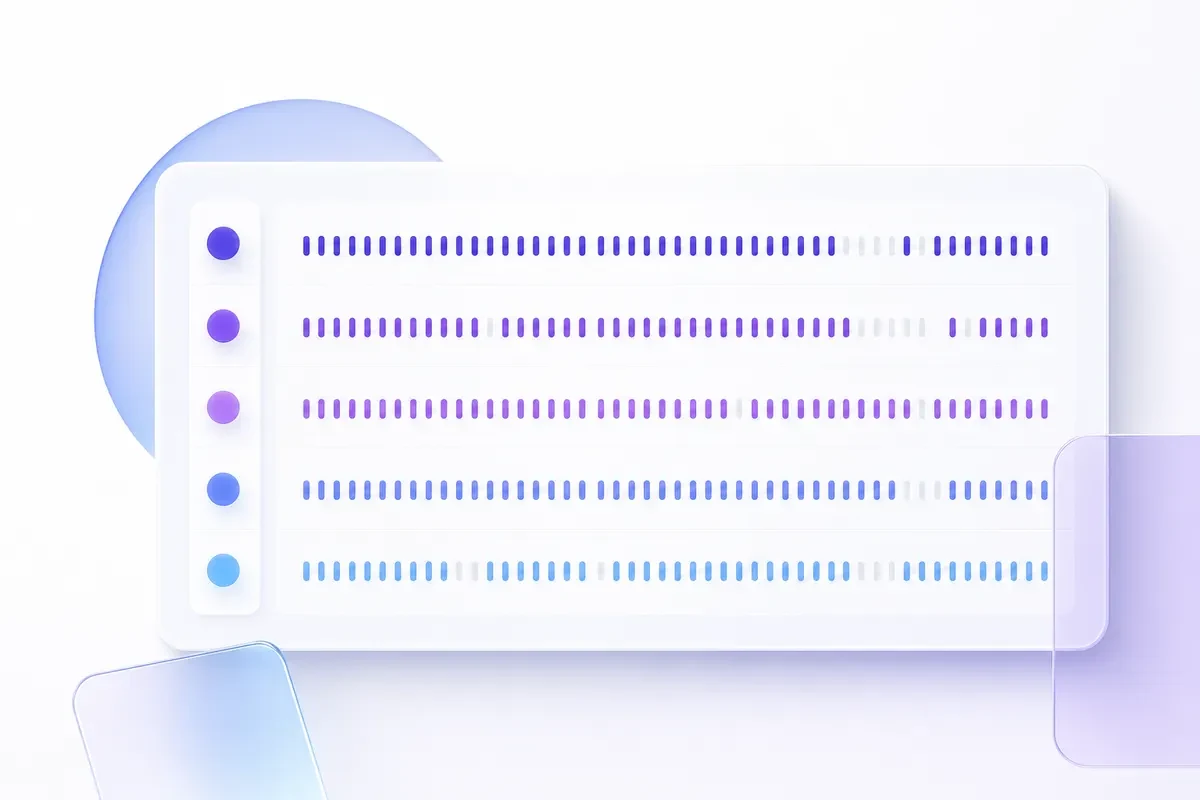
Open the dashboard and scan every monitored tool at once. This immediately answers “is it just me, or is everyone affected?” If several services are degraded simultaneously, the cause is often a shared dependency such as a cloud provider rather than any one company. If only one is struggling, that is a service-specific issue.
Drill into the services you actually use
From there, open the specific pages for the tools you depend on, for example Gemini, Grok, or Copilot, and study their history rather than just the current dot. Look for the rhythm: are disruptions rare and short, or frequent and clustered around certain hours? Recurring problems at peak usage times point to capacity limits, which behave predictably. Random, isolated incidents point to one-off failures, which are harder to plan around but often less chronic.
Compare across multiple time windows
Apply the lesson from earlier. Check the same service over a day, a week, and a longer stretch. A tool that looks unreliable today but solid over months is having a bad day. A tool that looks fine today but shows a repeating weekly dip has a structural issue worth weighing.
Cross-reference with the methodology
Before you treat any status as gospel, read how it is measured. Our methodology page explains what we check, how often, and what we count as an incident, so you can interpret the data with the right context instead of assuming every green light means identical things.
The tradeoffs: newer and cheaper vs established
Reliability does not exist in a vacuum. It trades off against cost, capability, and how new a service is, and the “most reliable” choice for you depends on which tradeoffs you can tolerate.
Newer and cheaper services
Fast-growing or lower-cost AI tools often deliver impressive capability for the price, but they are more prone to growing pains. Rapid user growth can outrun infrastructure, leading to demand-driven slowdowns and capacity limits during busy periods. A free tier in particular may be the first thing throttled when load spikes, because paying and API customers are prioritized. None of this makes a newer service bad. It simply means you should expect more variability and check its live status more often before relying on it for anything time-sensitive.
Established providers
More mature services usually have hardened infrastructure, redundancy across regions, and dedicated reliability teams. They tend to recover faster and communicate more clearly. But scale brings its own risk: when a very large provider does go down, it affects an enormous number of users at once, and the popularity that makes a tool trustworthy is the same popularity that strains it at peak demand. Even the most established names experience capacity-driven slowdowns when usage surges.
Demand-driven capacity limits
Almost every AI service shares one reliability constraint: compute is finite and expensive. When demand spikes, whether from a viral moment, a new feature launch, or simply the busiest hours of the day, capacity limits kick in. You may see rate limiting, queueing, slower responses, or temporary feature restrictions. This is not a “down” event in the traditional sense, but it absolutely affects whether the tool works when you need it. Comparing how gracefully different services handle peak load, by watching them during busy periods on the dashboard, tells you more than any static benchmark.
Building your own reliability judgment
Put it all together and a practical method emerges. To decide which AI tool is most reliable for your needs:
- Define reliability for your use case first – raw availability, speed, or feature consistency.
- Never trust a single uptime percentage; check multiple time windows.
- Distinguish full outages from degraded and partial states, and weigh the ones that hurt your workflow most.
- Treat a transparent, fast-updating status page as a point in a provider’s favor.
- Combine official status with crowd-sourced reports for the truest picture.
- Watch your candidate tools during peak hours, not just quiet ones.
Reliability is a moving target, and the only honest way to compare it is to look at live, current data rather than a claim frozen on a sales page. When an outage does hit, our guide on why these tools fail will help you understand what is happening, and the live dashboard will always show you which services are healthy right now so you can switch if you need to.
Frequently asked questions
What makes an AI tool reliable?
Reliability combines four things: availability (is it reachable), performance (is it fast under load), consistency (do features stay stable), and recovery (how quickly and openly it bounces back from problems). A tool can score well on one and poorly on another, so the most reliable choice depends on what matters for your use. Always judge the whole pattern over time, not a single headline number.
Is a higher uptime percentage always better?
Not necessarily. A monthly uptime figure averages everything into one number, so one concentrated bad day and a scatter of tiny blips can produce identical percentages despite feeling very different. The measurement window and the definition of "down" change the result. Check several time windows, a day, a week, and a longer stretch, before trusting any single percentage as proof of reliability.
What is the difference between a full outage and degraded service?
A full outage means the service is completely unreachable and requests fail across the board. Degraded service means it still responds but slowly, unevenly, or with weaker output, while a partial outage means some features work and others do not, such as chat being fine while file uploads fail. Degraded and partial states are more common than full outages and harder to detect.
Why does a public status page matter when judging reliability?
A status page does not cause outages, it reveals them. A provider that publishes honest, fast-updating status information demonstrates strong internal monitoring and a culture of accountability, and gives you a place to confirm whether a problem is on their side. A page that stays green while users complain is a warning sign. Transparency itself is a meaningful reliability signal worth weighing.
How can I compare AI tools side by side right now?
Open the live dashboard at / to see ChatGPT, Claude, Gemini, Grok, Copilot, DeepSeek, and Character.AI in one view. Scan for simultaneous issues that point to shared causes, then drill into the services you use and study their history across multiple time windows. Cross-reference the methodology page so you know exactly what each status reflects before drawing conclusions.